High quality tools for innate immunity research and drug discovery
Option 1: Discover new anti-cancer compounds
In this project, you will analyse data from screens of our Phytotitre library of natural extracts to discover agents with capacity to inhibit the growth of tumour cell-lines grown in vitro. Positive hits from your project could be explored further to help develop new chemotherapy drugs.

This project is a computer-based project requiring no access to the laboratory.
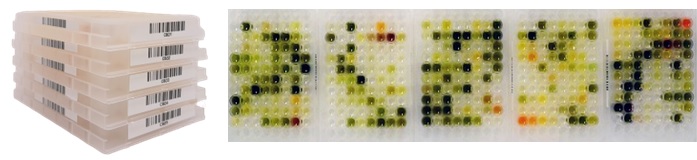
You will explore datasets from real world, in-house screens of our Phytotitre library comprising 800 extracts of traditional medicines and herbs. The aim is to identify natural products that are capable of inhibiting growth of the following tumour cell-lines: A2780 (ovarian cancer), HepG2 (liver cancer), MCF-7 (breast cancer) and PC3 (prostate cancer).
The data are given in the form of raw absorbance values from each plate measurement in Microsoft Excel format. You will first learn how to perform background corrections and normalisation of data to positive and negative controls. You will then calculate Z' factor scores to explore assay reproducibility for each plate. After mapping the resulting data to respective extract IDs, you will aim to identify the top hits for inhibition of growth of each tumour cell-type. Correlations can then be sought between the observed bioactivities and the properties of each of the extracts. You will then explore whether the bioactivity of the top hits can be validated by performing four parameter dose curve fitting to calculate the IC50 of hit extracts.
Four Excel files are available to download - one per cell type - each with over 8,000 data points for analysis.
Through this project, you will gain experience of many skills which are in much demand currently from employers. For example, you will practise general Microsoft Excel data handling techniques, calculation of assay Z' factor, alignment of phenotypic data with plate maps, preparation of appropriate charts and relevant statistical analyses.
A very basic version of this project can be completed in several weeks. However, this timeframe can be extended substantially by exploring more complex correlation analyses, or comparing your findings with the existing literature in more depth, on the advice of your supervisor.
To get started, simply read the project outline given below, then follow each of the method sheets in the order shown in the table to explore this particular research question.

Method Sheets for Cancer Biology Data Analysis Project 1 - Discovery of new anti-cancer agents
Datasets to download for Cancer Biology Data Analysis Project 1 - Discovery of new anti-cancer agents
Screen of the Phytotitre library for inhibitors of growth of the A2780 tumour cell-line 
Screen of the Phytotitre library for inhibitors of growth of the HepG2 tumour cell-line
Screen of the Phytotitre library for inhibitors of growth of the MCF-7 tumour cell-line
Screen of the Phytotitre library for inhibitors of growth of the PC3 tumour cell-line
Replication study of the top five hit extracts for inhibition of growth of the MCF-7 tumour cell-line
Dose response of extract #736 Schizandra for inhibition of growth of the MCF-7 tumour cell-line
How do I get started?
First, discuss with your supervisor whether this project will be suitable for your aims. If they agree, then feel free to download the relevant project guides and data files (in Microsoft Excel format) from our website.
What support is available to help me complete my project?
Our online project guides offer suggestions for suitable hypotheses to test, and research questions to address, during your project. A list of specific data handling and analytical methods to help you complete each project variation is also given. Individual method sheets give step-by-step instructions on how to perform each stage of the analysis. Working through these method sheets in the order given in the project guide will help you to answer a specific research question. Please visit the individual project pages to see examples of how the guides and method sheets support individual projects. Day to day support will be from your university project supervisor.
How long does each project take?
This is very flexible and can be decided between you and your supervisor. The outlines we offer include many possible options for each project. A basic project can be completed in 8 weeks or less. Adding more experiments or analytical approaches can extend the project to 8 months or more.
Do I have to register or make a purchase to use the online data?
No. The online data and respective project guides and method sheets are free to download from our website without requirement for registration or making a purchase.
Where can I find further technical information on the Phytititre library?
More detailed technical information on the library properties is available here.
What are the advantages of focussing on natural products for drug discovery?
Natural products have historically been a highly successful source of new drugs (e.g. most antibiotics, many anti-cancer agents, statins, blood pressure drugs etc.). By focusing on plants with a history of oral use in man, the Phytotitre collection furthermore aims to maximise the chances of discovering drug leads which are both bioactive against a relevant target and of low toxicity. Further information on this topic is available here.